
Overview
How fast can you pull multi-period SMA, volatility, percentage change and variance indicators — for any combination of crypto pairs at any exchanges?

What is Technical analysis (TA)?
Technical analysis (TA) indicators are transformations of underlying price series data. They are prolific in trading and with chart happy trolls. They’re also very difficult to actually get the raw data for. Not anymore.
The above example demonstrates how easy it is to use the most fundamental and powerful TA transformations in Cryptosheets (moving averages, volatility, period change, variance — upon which nearly all other TA indicators are built)
Examples
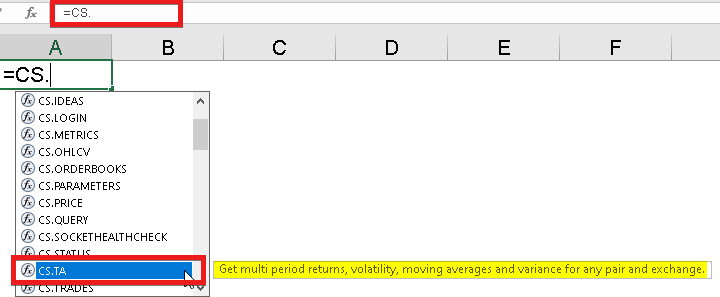
Using custom functions
From any cell in your spreadsheet type the following
=CS.TA()
Example Scenario:
User wants to easily identify trending patterns or "crosses" where longer term moving averages cross over or through shorter term averages.

(Possible) Data fields returned:
value | Price of the asset in USD
base | Symbol or symbols of the asset using csv (BTC)
quote | Query based off of a specific quote symbol
exchange | Query based off of a specific name or names for exchange
change1 | Percent Change for the trailing
1 periods(usually days)
change10 | Percent Change for the trailing
10 periods(usually days)
change180 | Percent Change for the trailing
180 periods(usually days)
change20 | Percent Change for the trailing
20 periods(usually days)
change30 | Percent Change for the trailing
30 periods(usually days)
change365 | Percent Change for the trailing
365 periods(usually days)
change5 | Percent Change for the trailing
5 periods(usually days)
change50 | Percent Change for the trailing
50 periods(usually days)
change7 | Percent Change for the trailing
7 periods(usually days)
change90 | Percent Change for the trailing
90 periods(usually days)
datetimeUTC | Date as the coordinated universal time (UTC) convention
sma10 | Simple moving average for the
trailing 10 periods(usually days)
sma100 | Simple moving average for the
trailing 100 periods(usually days)
sma20 | Simple moving average for the
trailing 20 periods(usually days)
sma200 | Simple moving average for the
trailing 200 periods(usually days)
sma30 | Simple moving average for the
trailing 30 periods(usually days)
sma365 | Simple moving average for the
trailing 365 periods(usually days)
sma5 | Simple moving average for the
trailing 5 periods(usually days)
sma50 | Simple moving average for the
trailing 50 periods(usually days)
sma7 | Simple moving average for the
trailing 7 periods(usually days)
var10 | Variance for the trailing
10 periods(usually days)
var20 | Variance for the trailing
20 periods(usually days)
var30 | Variance for the trailing
30 periods(usually days)
var5 | Variance for the trailing
5 periods(usually days)
var50 | Variance for the trailing
50 periods(usually days)
var7 | Variance for the trailing
7 periods(usually days)
vol10 | Volatility for the trailing
10 periods(usually days)
vol20 | Volatility for the trailing
20 periods(usually days)
vol30 | Volatility for the trailing
30 periods(usually days)
vol5 | Volatility for the trailing
5 periods(usually days)
vol50 | Volatility for the trailing
50 periods(usually days)
vol7 | Volatility for the trailing
7 periods(usually days)
Using templates
Open the TA Indicators template from the side panel: https://app.cryptosheets.com/#/templates/191

Multi period technical analysis indicators for thousands of pairs across hundreds of exchanges
Best part?
it’s just a formula so you can change and refresh it whenever you want

Multi period technical analysis indicators for thousands of pairs across hundreds of exchanges
________________________________________________________________
TAGS: googlehseets, excel, technical analysis, indicators, TA, moving average, volatility, variance, percent change, roi, sma, ema